Everything You Want to Know About Hospital-Employed PAs
Higher Salaries, Longer Shifts, More Leadership Opportunities
Note: This piece was first published in the 2018 AAPA Salary Report as a section entitled “More than One-Third of PAs are Hospital-Employed.”
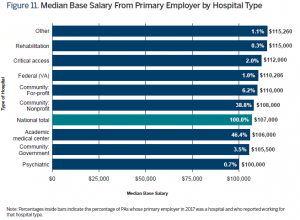
PAs employed by hospitals comprise 34.9% of PAs in the profession. Academic medical centers are the most common hospital employer, with nearly half (46.4%) of hospital-employed respondents working for them. Almost two in five (38.8%) hospital-employed PAs work for community nonprofit hospitals, and nearly 15% of such PAs reported they are employed by other hospital types. Figure 11 shows how different hospital types differ with regard to the median base salary paid to PAs.
Median Base Salary From Primary Employer by Hospital Type
Compared to PAs employed by physician practices, PAs employed by hospitals tend to work longer shifts (10 vs. 9 hours) and see fewer patients per week (50 vs. 75). A much lower percentage of PAs employed by hospitals specialize in primary care (6.5% vs. 27.2% in physician practice), and are more likely to specialize in internal medicine (16.6% vs. 12.2%), pediatric subspecialties (2.4% vs. 0.5%), surgical subspecialties (36.5% vs. 28.1%), and emergency medicine (13.7% vs. 5.8%).
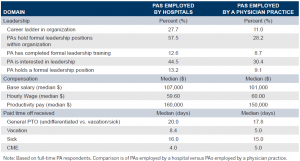
PAs employed by hospitals also have different career opportunities than those employed by physician practices. Hospital PAs are more likely to report there is a career ladder in their organization (27.7% vs. 11.0%), and are more likely to report that PAs hold formal leadership positions at their organization (57.5% vs. 28.2%), more likely to have completed formal leadership training (12.6% vs. 8.7%) than their counterparts employed by physician practices. They are also more likely to report being interested in leadership (44.5% vs. 30.4%) and in a formal leadership position (13.2% vs. 9.1%). It is unclear whether PAs interested in leadership may choose to work at a hospital, or whether exposure to these differences in opportunities may lead to higher numbers interested in and training for leadership.
Finally, PAs employed by hospitals receive different compensation and benefits than those employed by physician practices. PAs employed by a hospital (regardless of work setting) tend to have higher base salaries than PAs employed by physician practices ($107,000 vs. $101,000). For hourly wages, they are paid similarly ($59.60 vs. $60 per hour). PAs employed by a hospital who are on a productivity model reported a median compensation of $160,000 vs. $150,000 for PAs employed by physician practice. Hospital and physician practice PAs overwhelmingly reported receiving a professional development budget (93.5% and 91.7%, respectively) and both groups receive a median $2,000 among those who do receive a professional development budget. On average, PAs employed by a hospital receive more paid time off than those employed by a physician practice: general paid time off, 20.0 vs. 17.8 days; sick time, 8.4 vs. 5.0 days; vacation time, 16.0 vs. 15.0 days, and continuing medical education time, 4 days vs. 5 days.
The 2018 AAPA Salary Report is free to AAPA fellow, student, and retired members, and available for purchase to nonmembers as well as sustaining, affiliate, associate, and physician members.
You might also like


Thank you for reading AAPA’s News Central
You have 2 articles left this month. Create a free account to read more stories, or become a member for more access to exclusive benefits! Already have an account? Log in.